How-to guide
Updated on: 12/01/2024
Table of Contents
Welcome to this extensive guide on harnessing the full potential of our short-term rental market analysis reports, empowering you to discover prime investment locations, identify the characteristics and amenities of top-performing properties, and accurately forecast their net revenue.
The end goal of our reports is to shed light on what works best in the current short term rentnal market, so you can assess the option of starting a short-term rental right next door.
Let’s begin by the exploring how to identify prime locations for Short-Term Rentals (STR).
Demand analysis
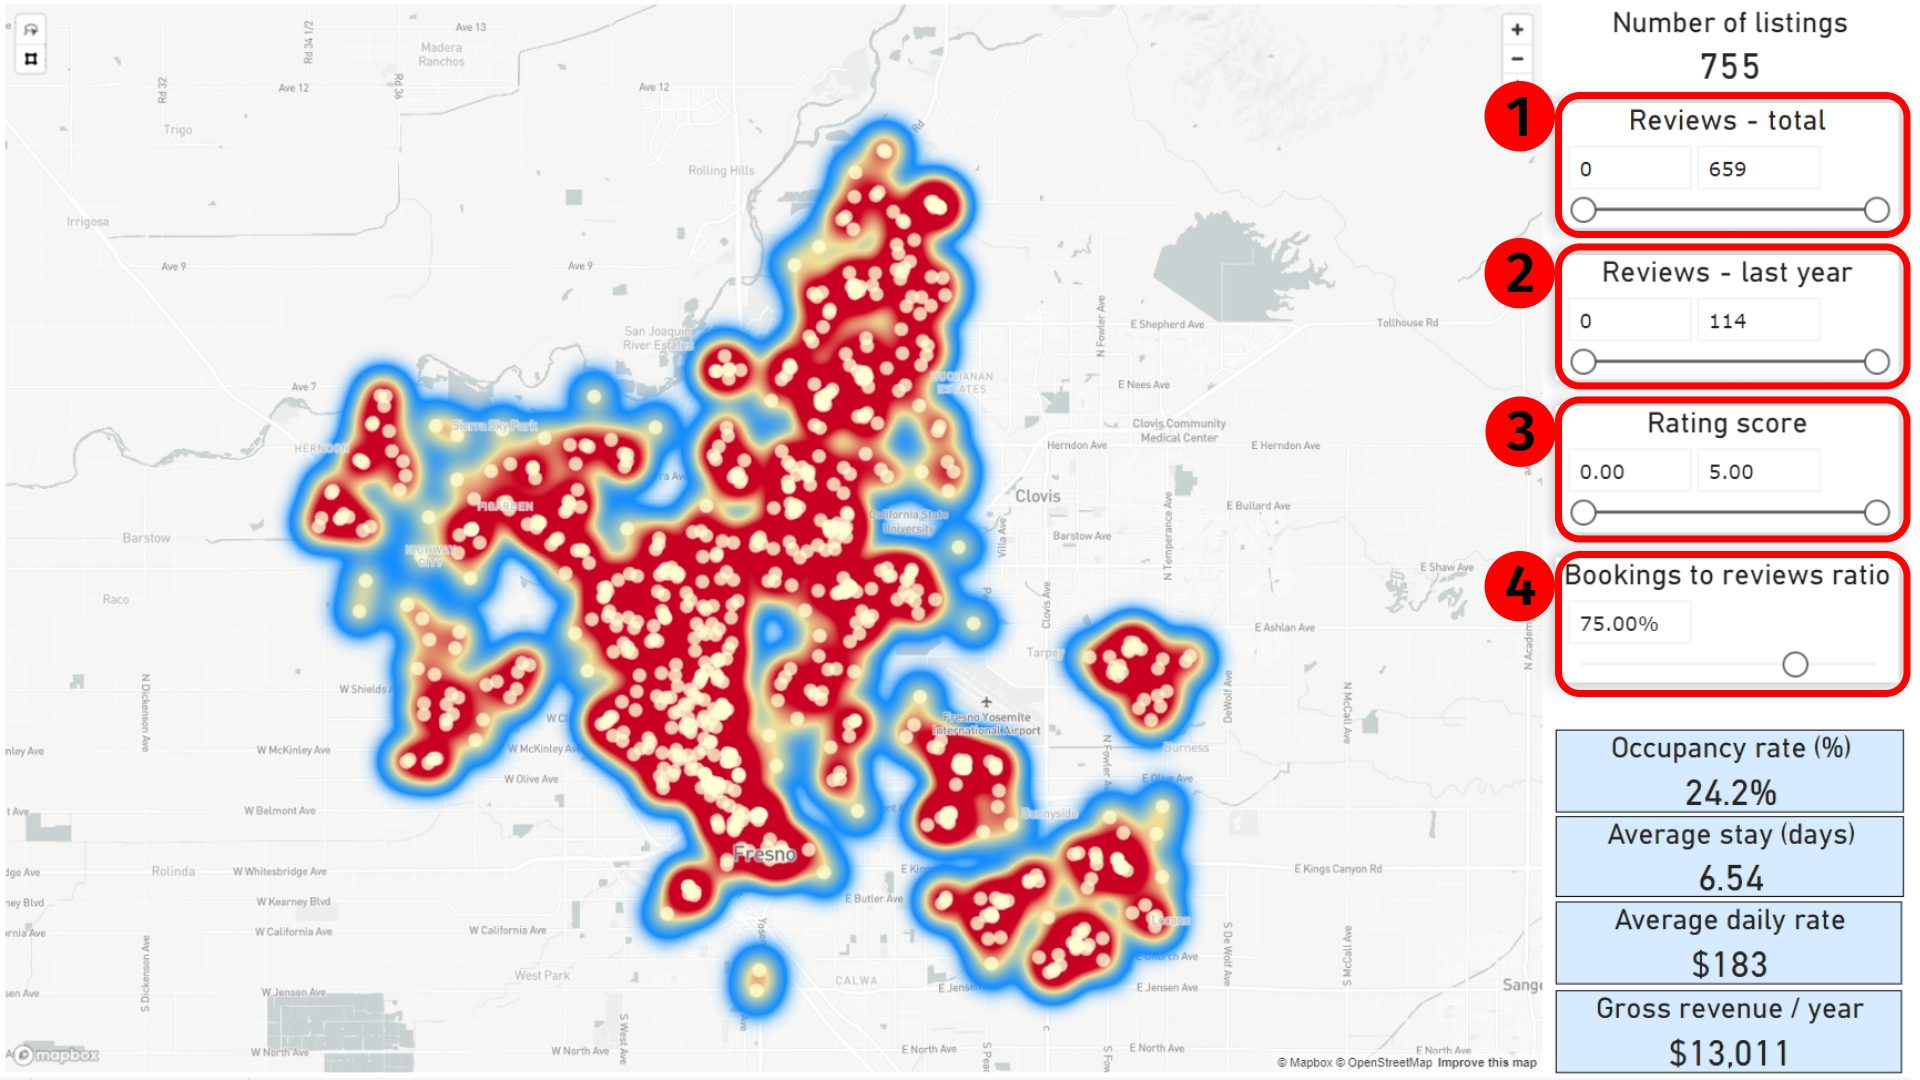
The objective in this first page of the report is to identify areas with high demand for short-term rentals throughout the entire year. To achieve this, we will use two filters that control the number of reviews for the listings displayed on the map (Figure 1, points 1 & 2). The top filter (1) manages the total number of reviews accumulated since the listing was created on Airbnb, while the second filter (2) regulates the number of reviews received in the last year.
We rely on reviews as the primary indicator for demand, and not on the unavailable days in calendars, for two distinct reasons:
- First, Airbnb doesn't provide historical data in the calendars, making it impossible to track past bookings. This not only poses a technical challenge, as checking every listing's calendar daily is impractical on a global scale, but it introduces the next significant issue.
- Relying on calendars to predict future bookings is inherently unreliable. Essentially, distinguishing between an owner blocking specific dates and guests booking their next trips is impossible to do with 100% accuracy, irrespective of the number of parameters scrutinized or the use of machine learning / AI algorithms.
To safeguard investors from overestimating the number of bookings of a specific listing, we will rely on the number of reviews, along with another parameter that we will discuss shortly.
Going back to the first page of the report, increasing any of the two first filters will help refine the map by eliminating listings with lower demand.
You can use the left dial to establish the minimum number of reviews and the right dial for the maximum number of reviews a listing can have.
For instance, you might employ the first case to identify areas with high demand and the latter for areas saturated with listings that struggle to secure bookings.
The next filter(3) adds a new dimension to your analysis by narrowing down listings based on their rating score. Generally, top-performing listings tend to have a high rating score, very close to 5 stars.
The last filter on this page, as previously mentioned, is the parameter used to calculate the number of bookings (4).
To achieve this, we take into account that not all guests will leave a review after their stay. Therefore, this parameter represents the percentage of guests who booked and subsequently left a review.
As an example, if this parameter is 100%, each review corresponds to one booking. On the other hand, if the parameter is 50%, then each review corresponds to two bookings.
So, what value should you assign to this parameter?
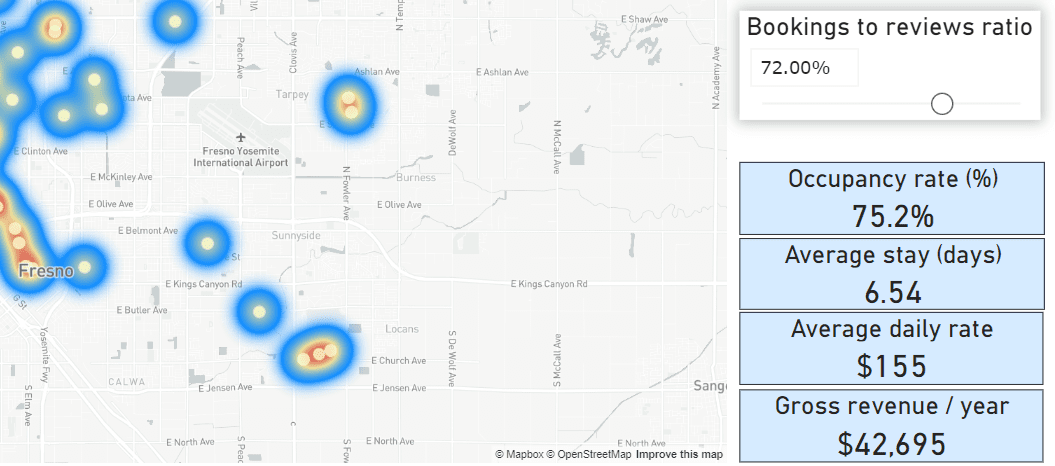
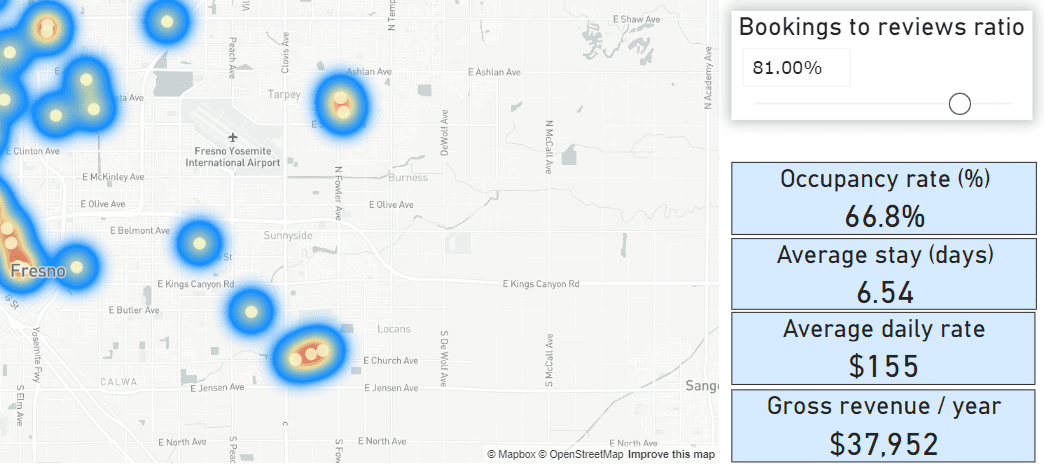
According to a post by the CEO of Airbnb Brian Chesky, this parameter is, on average, 72%. Naturally, for top-performing listings, this value tends to be higher, as hosts often actively encourage their guests to leave a review with the maximum rating after their stay.
As shown below, under identical conditions, a higher value of this parameter correlates with lower occupancy rates and revenue.
Below, you can find more details about the variables computed on this page:
Occupancy rate:
The occupancy rate is determined under the premise that the listing is available for rent every day of the year, totaling 365 days. Therefore, this value represents the percentage of days that the listing was booked during the last 12 months. To compute the number of days booked, we employ the number of reviews in the last year, the bookings-to-review parameter, and the average stay, which will be discussed below.
Average stay:
This figure is determined by examining stays that are less than 14 days in length and computing the mean length of stay across all listings on the map.
The choice of a 14-day threshold is rooted in the challenge of distinguishing between guest bookings and host blockings in the calendars, as previously highlighted. While the platform doesn’t explicitly differentiate between these two events, a notable exception arises when an entire month is marked as unavailable. In such cases, it can be reasonably inferred that this indicates a host blocking, especially since local regulations often categorize anything booked for more than 30 days as a non-short-term rental activity.
To maintain a conservative approach, our model considers any calendar unavailability exceeding 14 consecutive days as a host blocking. Consequently, these extended periods are excluded from the calculation to ensure a more accurate representation of guest stays.
It is important to note that when filtering, or highlighting listings on the map, the average stay value will adjust to reflect the average for the specific listings present on the map.
A brief note on the multiselection tool (also called lasso tool):
If you want to analyze a specific area on the map, you can use this tool to highlight listings on the map. All the charts on that page of the report will then display data specific to the selected listings on the map (dark blue). Below, you can find out how to use the multi selection tool.
Average daily rate:
The average daily rate is determined through the following process:
- Initially, we evaluate the daily rate for each listing for a 7-day booking with 1 guest, spanning over an entire year. Essentially, if a listing is available every day for the next 365 days, we would get 52 data points containing the average daily rate for each week of the year. The choice of seven days is deliberate, as many listings have a minimum 7-day booking policy that we aim to consider. Opting for bookings of 1 guest is also intentional, considering that many individuals are aware of additional fees for extra guests. Consequently, when feasible, such as in self-check-in/out bookings, people tend to book as a single guest instead of specifying the actual number. As our analysis leans towards conservatism, we refrain from assuming that individuals will consistently act fairly and willingly pay extra fees for additional guests.
- Given that some hosts charge a cleanning fee, we have incorporated this fee into the overall calculation of the average daily rate. The method of obtaining the average cleaning fee per day of booking follows the exact same methodology as described in the previous paragrah.
- Subsequently, we calculate the average of these daily rates across all the listings available on the map. If you use the multiselection tool to focus on a specific area, this value will represent the average rate among the highlighted listings.
Average annual bookings:
To obtain this value, the algorithm uses the bookings to reviews parameter in conjunction with the total number of reviews for each listing in the last 12 months. Finally, the algorithm computes the average number of bookings across all the listings selected on the map.
Therefore, by using the multiselection tool in conjunction with the reviews filter, you can analyze the number of annual bookings of the top performing listings within a specific area in your city of interest.
Market overview
The primary objective of this page is to deep dive into the details of short-term rental listings within a specific neighborhood of your chosen city.
Through the use of the multiselection tool, the charts on the right half of the screen will showcase data tailored to the highlighted listings.
Important notes:
- If the chart features a slider on the left-hand side, utilize it to zoom in and gain a more detailed visualization of the data highlighted on the map.
- Hovering over the visuals on the chart triggers a tooltip on the screen, displaying the precise values associated with that particular visual.
Another feature of this report is the capability to filter listings on the map using the visuals on the charts. For instance, clicking on the 3 bedrooms bar of the “Listings by Bedrooms” chart will exclude any listings on the map that do not have 3 bedrooms. You can add multiple filters by pressing Ctrl + left click on subsequent charts, as shown in the video below:
To remove the filters from the page, simply click on a blank space within any of the charts that you have selected.
It’s important to note that the filters applied on this page of the report by using the charts will not be carried over to other pages. For a better control over the filters in your report, you can navigate to the master filter page of the report and select the filters you wish to apply, as shown below.
Please note that the filters on the Master Filter Page will be applied to all pages of the report.
Returning to the market overview page, below, you will find additional information about the charts displayed on this page.
Listings by bedrooms
This chart illustrates the number of listings on the vertical axis and the number of bedrooms on the horizontal axis.
Listings by bathrooms
Similar to the previous chart, this one pertains to the number of bathrooms. You may observe listings with 0.5 bathrooms, indicating a configuration where the bathroom consists of just a toilet and a sink.
Accomodates
This visual showcases the capacity of the unit in terms of the number of guests it can accommodate.
Daily Rates Distribution
The vertical axis of this chart represents price ranges in intervals of 25 units of the currency used in the report. The horizontal axis depicts the number of listings with an average daily rate falling within each price range, as a percentage. Hovering over a bar in this visual will reveal a tooltip indicating the number of listings within that specific price range.
In the case of multiselecting listings on the map, the horizontal axis will display the highlighted listings in dark blue, illustrating their proportion to the total listings within that price range in the municipality.
Rental Type:
The report considers three distinct rental types:
- Entire unit: e.g., an entire apartment or house.
- Private room: e.g., a single room within an apartment or house.
- Special rental: e.g., a boat, a campervan, or a glamping.
Property Type:
There are four categories:
- Apartments/Condominiums
- Houses
- Private Rooms (located inside apartments or detached houses)
- Special: e.g., boats, motorhomes, etc.
Is Superhost?
The pie chart depicts the number of listings where the host has the Superhost badge. Superhost status is often associated with top-performing hosts.
Property details
This page of the report presents detailed information in a dynamic table concerning the various listings on the map. Utilizing the multiselection tool will filter the table to display only the listings you have selected.
On the right side of this page, you’ll find several filters, and a Filter page button that will take you to the master filter page.
An important note: If you've applied any filters from the demand analysis page (e.g., total reviews), those filters will carry over to this page. For more precise control of the filters, it's recommended to use the master filter page.
Clicking on the headers of the table allows you to sort that column, toggling between descending and ascending order with each click.
Additionally, you can select individual rows in the table, and the map will pinpoint the exact location of that listing. To select multiple listings on the table, you can press Ctrl + left click, as shown below.
As a side note, if you want to find a specific listing on Airbnb, you can use either the listing ID or the listing title in a Google search. We recommend the latter option, as searching listings using the listing ID may yield no result, as this ID tends to change over time. Another method to identify a listing on Airbnb is by searching its location directly on the map.
Among the different headers you will find on this page, most are self-explanatory, although we will highlight two notes below:
Average daily rate:
This represents the average daily rate set by the host for a 7-day booking with 1 guest, excluding the cleaning fee. The calculation of this average is based on a one-year period. Therefore, if a particular listing is available in the next 365 days, there should be 52 data points contributing to the calculation of this average. For more details on how this rate is calculated, please refer to the Demand Analysis section.
Average daily cleaning fee:
Similar to above, this calculation pertains to the cleaning fee per day of booking only.
The occupancy rate and the average number of bookings are calculated in the same manner as described in the Demand Analysis page of the report.
Amenities details
On this page of the report, the goal is to identify the most frequent amenities within the selected listings on the map. The visual representation on the right side of the page highlights the top 100 most common amenities. Larger font sizes indicate higher prevalence among the listings chosen on the map.
Applying various filters through the master filter page (e.g., listings with a high number of reviews in the last year, etc.) and utilizing the multiselection tool on the map will enable you to discern the specific amenities that top-performing units in a particular neighborhood have.
Hovering over the text in this visual will reveal a tooltip indicating the number of selected listings on the map that possess that specific amenity. Clicking on a particular amenity on the chart will showcase the listings on the map that feature that amenity. Note that you can use Ctrl+left click to choose multiple amenities in the chart. To reset this filter, simply click on a blank space in the chart.
Seasonality analysis
This page features a chart to provide insights into the seasonal impact on short-term rentals in your chosen municipality. The timeline is represented along the horizontal axis, while the vertical axis illustrates the total number of reviews across all listings for each specific month.
By horizontally scrolling to the right on the chart, you will observe the seasonal effects in the most recent years.
Two important notes:
- You might notice that the demand is more pronounced in recent years than in previous ones. This is because some listings that were available, let's say 4 years ago, might have been removed from Airbnb by the host. Therefore, the algorithm we use can only account for reviews of the listings available on the day of obtaining data from Airbnb. For this reason, we recommend focusing on the timeline spanning 1-3 years in the past, as older dates may not include reviews for listings that have been removed by the hosts.
- Filters applied on the master filter page will not impact the chart on this page.
Pricing analysis
Daily rate analysis
This page features a chart illustrating the average values of the daily rates (excluding the cleaning fee) for the listings selected on the map. The daily rates have been calculated based on a 7-day booking for 1 guest. The rationale for this calculation has previously been discussed in the demand analysis and product details pages of the report. However, the process will be reiterated below for clarity:
- First, we evaluate the daily rate for each listing for a 7-day booking with 1 guest, spanning over an entire year. Essentially, if a listing is available every day for the next 365 days, we would get 52 data points containing the average daily rate for each week of the year. The choice of seven days is deliberate, as many listings have a minimum 7-day booking policy that we aim to consider. Opting for bookings of 1 guest is also intentional, considering that many individuals are aware of additional fees for extra guests. Consequently, when feasible, such as in self-check-in/out bookings, people tend to book as a single guest instead of specifying the actual number. As our analysis leans towards conservatism, we refrain from assuming that individuals will consistently act fairly and willingly pay extra fees for additional guests.
- Subsequently, we calculate the average of these daily rates across all the listings available on the map, for every week. If you use the multiselection tool to focus on a specific area, the values on the chart will represent the average rate among the highlighted listings.
You may observe that some listings have no data for this chart. This occurs when a booking is unavailable for a specific time period, and as a result, our algorithm cannot display the rate for those unavailable dates.
Important note:
The top left-hand side of the map features a box displaying the average daily rate over an entire year for the listings highlighted on the map. To calculate this value, the model considers all the values from the bar chart above and computes the average, excluding zero values, of course. If you hover over the map, this text box disappears from view to facilitate effective selection of listings on the chart. When the user hovers over the chart above, the text box reappears.
Daily cleaning fee analysis
The rationale for this page is identical to the daily rate analysis.
You may observe that some listings have no data for this chart. The reason is that the host either doesn’t charge guests a cleaning fee, or the booking is unavailable for a specific time period. Therefore, our algorithm cannot display the rate for unavailable dates.
Financial case study
This page of the report contains all the parameters that contribute to the financial model. It is important to note that the prepopulated values are provided solely for orientation purposes.
Therefore, it is essential for you to consult with your advisor, real estate agent, or lawyer to determine the accurate values for these parameters tailored to the specific property you intend to purchase and your individual circumstances before making any investment decisions.
The financial case study evaluates the performance of short-term rentals over a one-year period. Consequently, the parameters on this page should be analyzed within a timeframe of one year.
These parameters are categorized into the following eight groups:
Revenue parameters
Average daily rate
This parameter represents the average rate you anticipate charging throughout the year. While the rate you will charge your guests will vary during high and low seasons, as reflected in the daily rate analysis page, we seek the average value for this parameter thoughout the year. This is because high revenue during peak seasons is balanced by lower revenue during off-peak times, making the average a robust indicative figure of the listing’s generated revenue. You can utilize the pricing analysis page to obtain a general indication of the average daily rates from the top-performing listings in the area you plan to invest in.
Average daily cleaning fee
The same rationale applies as for the average daily rate.
Total reviews (yearly)
This parameter indicates the total number of reviews you anticipate for your listing over the course of one year. To estimate this figure, you can refer to the property details page, which provides information on the number of reviews in the last year for top-performing units in your area of interest. Utilize the header to sort them in descending order, allowing you to observe the yearly review counts for the top-performing units in that area.
Average stay (days)
This parameter represents the average duration per booking throughout one year. You can approximate this value using the first page of the report, the demand analysis page. For details on how this figure was calculated on that page, please refer to the Demand Analysis section of this how-to guide for a more detailed explanation.
Bookings to review rate
This parameter indicates the percentage of guests expected to leave a review after their stay. A higher value makes the analysis more conservative. For additional details about this parameter, please refer to the Demand Analysis section of this guide.
Bookings per year
This is not a parameter that you can directly adjust. The value displayed in this box is the outcome of computing the anticipated number of reviews over one year and the bookings to review rate parameter.
Occupancy rate
This is not a parameter either. The value displayed is the percentage of booking days that we are expecting over 365 days. This value is the result of computing the anticipated number of reviews over one year and the bookings to review rate parameters.
Property tax
The parameters on this section refers to the amount of property tax that you are expected to pay on a yearly basis. Once you identify a property in the for sale market, please speak to your agent and confirm the exact amount of property tax that you are expected to pay thoughout an entire year.
Renovations
This parameter represents the budget allocated for renovating the property that you intend to purchase.
Running costs
Condominium / Home Owners Association fee / Community fee
This fee typically applies to properties with shared amenities accessible to all homeowners in the building. You can find out the exact cost of this fee by talking to your real estate agent.
Utility bills
This represents the annual cost for water, electricity, and/or gas bills. You can obtain an estimate by consulting a rental management company and asking for projections based on units from their existing portfolio.
Internet bill
This refers to the annual cost of the internet service provider.
Maintenance & repairs
This represents the anticipated annual cost for property maintenance and repairs.
Home insurance
This is the yearly premium for home insurance. Keep in mind that some countries may mandate hosts to have home insurance before renting out their unit. Consult with your legal advisor if this applies to your situation.
Short term rental operational costs
These are costs specifically associated with operating a short-term rental.
Rental management fee
This fee represents the percentage of gross revenue that a rental management company will charge you over the course of one year. If you’re not using a rental management company, you can set this value to 0.
Turnover Costs
This parameter refers to the expenses incurred between bookings to prepare the unit for the next guests. These costs typically include cleaning and laundry.
Supplies
This parameter encompasses the cost of supplies for each booking. These costs may include items such as a bottle of champagne to greet the guests or a welcome bag. If you do not provide any supplies to your guests, set this parameter to 0.
Accounting Costs
This refers to the annual fee paid to your accountant, solicitor or tax advisor for filing tax returns on your behalf. If you do not use this service, set this parameter to 0.
Airbnb Fee
This represents the percentage of your annual gross revenue that Airbnb charges as their commission. If you are using the split fee model, the value is typically 3%. Please refer to the fees section on Airbnb.com for a detailed understanding of the commission that Airbnb will charge from your revenue.
Other fees and expenseses
This parameter encompasses any additional costs incurred throughout the year that have not been explicitly considered in the model. You can allocate a buffer in this category to ensure a more conservative analysis.
Purchase details
Purchase price
This parameter represents the purchase price of the property you plan to invest in, excluding any taxes or fees.
Closing costs
This parameter refers to the percentage of the purchase price allocated to cover taxes and fees associated with the transaction. Consult with your real estate agent or legal advisor to determine the specific percentage applicable to your situation.
Loan details
Interest rate
This parameter represents the annual interest rate determined by your lender. Our model assumes a fixed interest loan. It is recommended to consult with your mortgage broker to obtain information on the interest rates offered by several lenders.
Loan to value
This parameter represents the percentage of the purchase price that can be financed by the lender.
Term
The number of years to repay the loan
PMI
This parameter represents the percentage of the financed amount dedicated to the private mortgage insurance (PMI). If you do not require mortgage insurance, set this value to 0.
Depreciation
There are several methods to depreciate the value of a property over time. Our model uses the straight line method.
The straight-line method of depreciation evenly spreads the cost of an asset over its useful life. It calculates depreciation by dividing the difference between the asset's initial cost and its salvage value (the estimated value at the end of its useful life) by the number of years it is expected to be in service. The calculation of the annual depreciation amount involves two key parameters:
Land value
This parameter represents the percentage of the purchase price attributed to the land. For instance, if a property has a purchase price of $100,000 and its land value is $20,000, the land value parameter would be 20%.
Depreciation rate
This parameter represents the percentage of the property value (excluding land) that you can depreciate each year. It is recommended to consult with your legal advisor to determine the precise amount eligible for depreciation based on differnt factors.
Case study results
This page of the report presents the outcomes of the business case. Similar to the parameters from the previous page, the results on this page are considered over a one-year period.
The results have been grouped ino the following four sections:
Revenue details
This section features a table providing a breakdown of the revenue generated by the listing, along with relevant deductions and overall expenses associated with operating the short-term rental.
Gross revenue
The gross revenue is calculated using the revenue parameters set on the previous page. This value is obtained by multiplying the number of booked days by the average rate throughout the year.
Applicable deductions
The applicable deductions are computed using the parameters from the cost model and the depreciation model. Deductible expenses include yearly interest on the loan, turnover fees, rental management fee (if applicable), utilities, HOA/community fees, property tax, supplies, maintenance, other expenses related to running the short-term rental, Airbnb commission, accounting, home insurance, PMI (if applicable), internet, and depreciation (straight-line method).
Overall expenses
We will briefly explore in the overall expenses section how this value was calculated.
Net revenue before tax
Finally, we have the net revenue before tax. Since the income tax amount depends on various factors, it is advisable to consult with your legal advisor to determine whether you can deduct expenses from the taxable base and to confirm the actual tax brackets based on your personal circumstances.
Mortgage details
This section provides several values related to the financing of the property. While most values are self-explanatory, we’ll focus on three key figures:
Loan amount
This value is derived from the purchase price and loan-to-value parameters.
Yearly repayments
This figure represents the total annual amount you must repay, encompassing both interest and principal. It assumes a fixed interest rate.
Closing costs
This value encompasses the fees, taxes, and expenses associated with the acquisition of a property.
Overall expenses
This table contains values from the costing model in the previous page. Again, most of the values are self explanatory, altough we will make an emphasis on the following ones:
Yearly loan repayment
This value corresponds to the amount outlined in the mortgage details section.
Turnover fees
This value is derived by multiplying the total number of bookings by the turnover cost established in the previous page.
Supplies
This value is calculated by multiplying the number of bookings by the cost of supplies per booking, as set on the previous page.
Airbnb commission
This is the commission charged by Airbnb for listing your property on their platform.
PMI
This value represents the private mortgage insurance, calculated as a percentage of the loan amount.
Rental management fee
This value is the fee payable to the rental management company for handling the rentals throughout the entire year. It is calculated based on a percentage of the gross revenue.
Total annual expenses
Finally, we have the total annual expenses value, which is the sum of all expenses listed in the table.
At the bottom right of the page, you'll find a graphical representation of the various expenses incurred on a yearly basis.
Case study results
This section highlights key values from the financial case. These include:
Net revenue before tax
Calculated by subtracting overall expenses incurred during the year from the gross revenue. Note that if the value is within brackets, the net revenue before tax is negative.
Annual CoC return
This percentage is the Cash-on-Cash return (before income tax) from operating the short-term rental during one year. This value is calculated by dividing the net revenue before tax by the cash required, which is equal to the sum of the deposit, the closing costs, and the renovation costs.
Cash Required
As mentioned earlier, this is the sum of the closing costs, renovation, and the deposit for the loan.
Annual ROI
This figure represents the Return on Investment (ROI) calculated by dividing the annual net revenue by the total cost of the investment, which includes the purchase price, closing costs, and renovation costs.